
June 17th Minnesota Tornadoes Case Study
On June 17th, 2010 a powerful storm system progressed across the Northern Plains and Upper Midwest, leading to an outbreak of severe weather and strong tornadoes across North Dakota and Minnesota. The damage resulting from the tornadoes, extreme wind, and large hail was catastrophic for several farming communities, particularly across north-central and far southern Minnesota. So far, there have been 20 tornadoes confirmed by the National Weather Service with 3 of these tornadoes of EF4 strength in Minnesota (1 in North Dakota) and 4 other tornadoes of EF3 intensity in Minnesota. Wind speeds with these tornadoes would have been in the 166-200 mph range for EF4 tornadoes and 136-165 mph range for EF3 intensity. All of these tornadoes occurred between 4-8 pm. This tornado outbreak was the most for the area since July 6th, 1999, when 17 tornadoes in North Dakotas and 3 in Minnesota, with an F4 tornado in Mountain, North Dakota.
Here is the link to my chase log if you are interested: http://eyeonthetwister.com/index.php/2010/06/0617/
To put this event into perspective, here are some facts that the National Weather Service - Twin Cities were kindly able to post on their site:
• The three EF4 tornadoes in Minnesota were the first EF4 or stronger tornado since the Granite Falls Tornado of July 25th, 2000.
• It was the most number of EF4 tornadoes or greater since Black Sunday, April 30th, 1967.
• The four total EF-4 tornadoes in Minnesota and North Dakota were the most in any one event across the country since the "Super Tuesday" Outbreak on Feb 5-6, 2008.
• The number of fatalities due to tornadoes in Minnesota was the highest since July 5, 1978 (4).
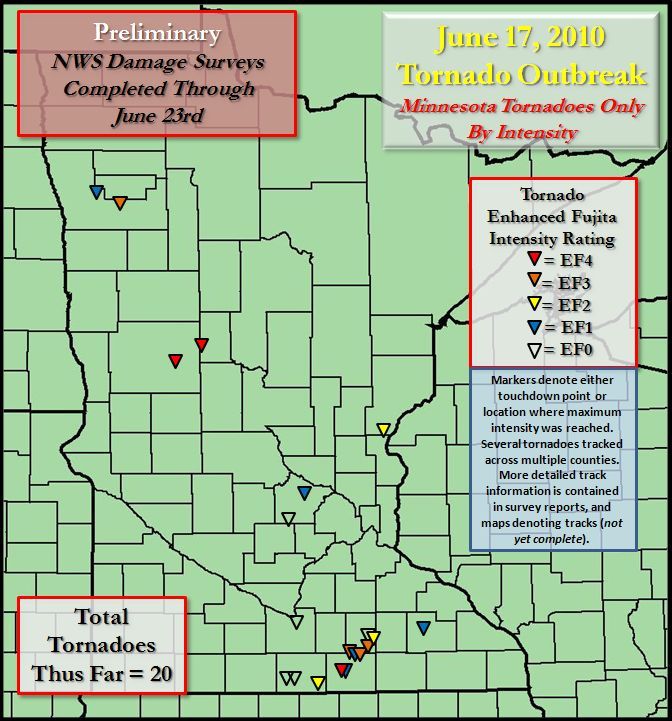
10June17MNtorsef
They synoptic set-up consisted of an upper level trough that had moved from the Pacific Northwest the day before to the northern High Plains by the morning of the 17th (Fig a). Upper level ridging was sliding towards the Great Lakes with upper level height falls across the Upper Midwest in response to the upper trough.

500-oa-12
Fig (a): Analyzed 500 mb plot from 12Z on the morning of June 17.
The 700 mb analysis (Fig b) shows a strong shortwave through western South Dakota into central Nebraska with very moist conditions ahead of the wave and significant drying in its wake. 700 mb temperatures of 10-12 deg C were analyzed as far north as south-central North Dakota at this time with warm advection ongoing, indicating that a strong cap was going to be in place as warmer air continued to be funneled north ahead of the shortwave. However, strong forcing was able to overcome the cap during the early afternoon.

700-oa-12
Fig (b): Analyzed 700 mb plot from 12Z on the morning of June 17.
There are some things to take away from the morning observed sounding from OAX (Fig c), which was likely the most indicative of the inflow sounding into the Minnesota storms. First is the ML CAPE that is already at 3372 J/kg and already an unstable airmass if updrafts were able to break through the warm air aloft near 800 mb. Another is significant drying in the mid levels of the atmosphere, which would allow for dry air entrainment into any storms, more efficient latent heat release and, consequently, more explosive updraft/downdraft combinations with any storms that could develop (this is very noticeable later on water vapor). In the wind fields, strong low level turning and increase in the winds is evident by the sounding and hodograph, leading to 0-1 km and 0-3 km SRH values of 386 and 395, respectively. This environment is already highly sheared and unstable during the early morning, making for a Supercell Composite of 1.
OAX_12_obs
Fig (c): The observed morning upper air sounding from OAX (Omaha, NE).
At the surface the morning of June 17th (shown in Fig d), I have analyzed a low pressure system across northwest South Dakota that has started to occlude along the South Dakota/North Dakota border. The warm front is difficult to analyze but I have placed it from along the border area to "The Hump" of western Minnesota where there is an apparent wind shift and cumulus deck and elevated thunderstorms developing north of this front. It does appear to trail down into western Minnesota and Iowa but does get washed out at the surface. Further west, a well defined trough extends south of the occlusion through central South Dakota into western Nebraska while, to the west, a dryline is mixing eastward.
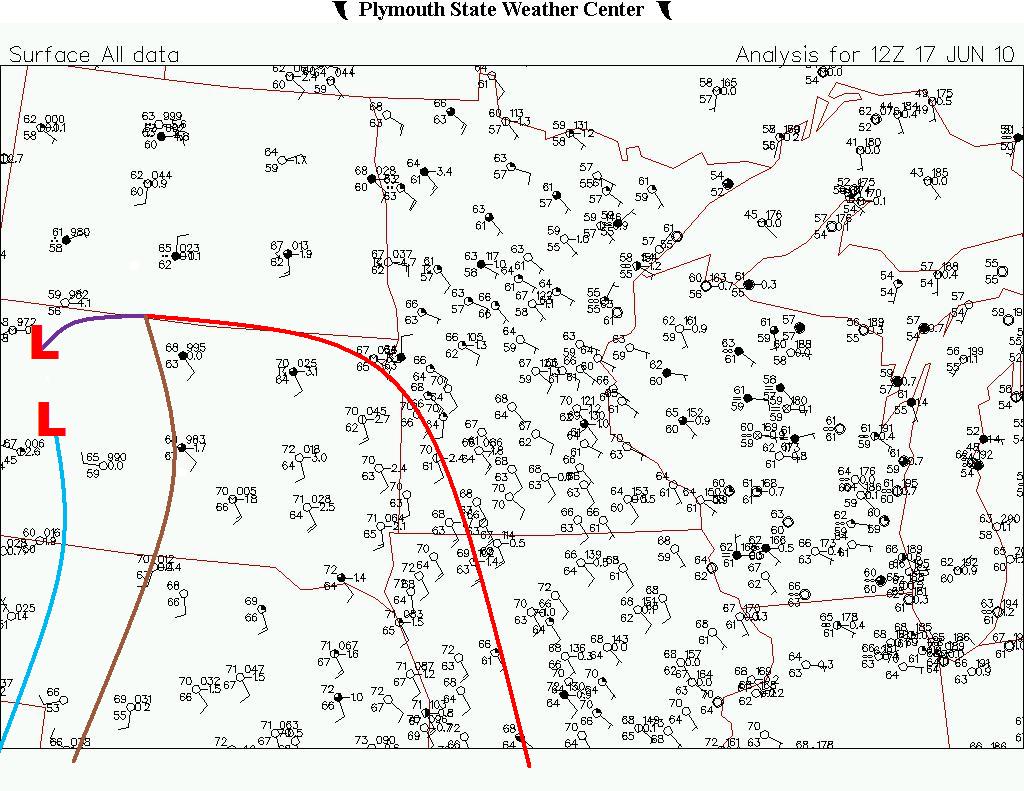
12Z Station Plot
Fig (d): Self analyzed 12Z surface plot from the morning of June 17. Warm front is in red, occlusion in purple, trough in brown, and dryline in blue. Also depicts location of surface lows.
By 18Z (1pm CT), the main surface low has lifted into southern North Dakota while the warm front has also lifted into central Minnesota (Fig e). The dryline and trough boundaries have been quickly on the move as well, now both positioned across eastern South Dakota. The low has been deepening as noted by the pressure falls throughout the region and the 994 mb reading at Bismarck, North Dakota. The boundaries are rather noticeable on the satellite image at the same time (Fig f), especially the quickly developing cumulus field across eastern South Dakota ahead of the surface trough. Initiation of storms does occur an hour later on the bulge of the trough as it enters west-central Minnesota. These storms were able to have unimpeded and strong inflow air out of the southeast at 15-25 mph with higher gusts throughout their life cycles, which contributed to the long lived storm and tornado durations and directly resulted in strong wind shear.

18Z Station Plot
Fig (e): Analyzed surface plot for 18Z (1pm CT) on June 17th. Warm front is in red, occlusion in purple, trough in brown, and dryline in blue. Also depicts location of surface lows.

18Z Satellite Image
Fig (f): Satellite image at 1745Z (12:45pm CT) on June 17.
Figures g and h depict the surface analysis and satellite image near 22Z (5pm CT) near the time the EF4 tornado impacted Wadena, Minnesota. Notice in Fig g, that Wadena is nearly directly on the analyzed triple point of the occlusion, warm front and trough, which likely enhanced the forcing and low level wind shear of the Wadena storm as it passed through the area. The dryline is also starting to become mixed out and rather diffuse as it enters western Minnesota at this time. In addition, the bulging trough is likely helping to enhance the explosive nature of the storms across southern Minnesota at this time. The inflow winds remain unimpeded out of the southeast, sustained at 15-25 mph with higher gusts ahead of this system.

22Z Station Plot Zoom
Fig (g): Analyzed surface plot for 22Z (5pm CT) on June 17th right at the time of the Wadena, MN tornado. Warm front is in red, occlusion in purple, trough in brown, and dryline in blue. Also depicts location of surface lows. Wadena is circled.

22Z AXN Sat Image
Fig (h): Satellite image from 2145Z (4:45pm CT) on June 17th. Notice the explosive development north of Alexandria and also near and south of Mankato.
On the water vapor image below (Fig i), what I thought was very interesting was, not only how evident the explosive nature of these storms were on water vapor, but also the dry punches occurring into the areas that had the strongest tornadic activity. As mentioned earlier, these dry punches likely led to signficant dry air entrainment into the supercells and efficient latent heat release and could have very well been an influence on why there were two seperate areas of tornadic storms while a large area of central Minnesota saw lesser severe weather.

00Z Water Vapor Image
Fig (i): Water vapor image from 2315Z (6:15 pm CT) as strong storms were still taking place across northern Minnesota and large, destructive tornadoes were ongoing across southern Minnesota.
The 300 mb analysis (Fig j) for 00Z 6/18 depicts the upper trough extension into North Dakota with a weak 60 kt jet into Minnesota but a 75+ kt jet streak into the Dakotas with the southeast to northeast flow. Notice that there is quite a lot of divergence taking place the Upper Midwest, especially in southern Minnesota and northern Iowa where the intense tornadic storms were still taking place at this time.

300-oa-00
Fig (j): Analysis of 300 mb observations at 8pm CT on June 17.
At 500 mb (Fig k), the 500 mb low is depicted to be across northwest North Dakota with an extension of the 500 mb trough into eastern North Dakota and northern Minnesota. 500 mb temperatures generally range from -8 to -11 across Minnesota. Judging by the wind fields and analysis, there was diffluence at this level taking place across much of the Upper Midwest at this time with mid level jet of nearly 70 kts into Minnesota per the ABR sounding. It would certainly help if MPX would have had a 00Z sounding on this day!

500-oa-00
Fig (k): Analysis of 500 mb observations at 8pm CT on June 17.
The shortwave is clearly evident in the 700 mb analysis (Fig l) with a wind shift from eastern North Dakota through central and southern Minnesota and cold advection in the wake of the trough across much of the Dakotas into western Minnesota. Notice the big moisture plume from southeast Nebraska northward to southern Minnesota.

700-oa-00
Fig (l): Analysis of 700 mb observations at 8pm CT on June 17.
At 850 mb (Fig m), the dryline/cold front is very evident per the sharp moisture gradient and cold advection behind the boundary. I call this a dryline/cold front because there is little to no surface cold air advection and it appears to all be just aloft, while all of the lower levels are showing a sharp drop in dewpoints/moisture. Notice as well the strong moisture advection into Minnesota ahead of the boundary, wrapping all the way northwestward into the occlusion that is now across southern Canada.
850-oa-00
Fig (m): Analysis of 850 mb observations at 8pm CT on June 17.
The figure below depicts the RUC analysis of the 700-500 mb lapse rates at 00Z 6/18. Lapse rates are steep across Minnesota and at 7.5 deg C/km or more, which contributed to the large hail that was experienced with many of the storms.

laps_100618_00
The figure below depicts the RUC analysis of Mixed Layer CAPE and CINH at 00Z 6/18. A nose of highly unstable air in the 1000-3000 J/kg range stretches from Iowa to north-central Minnesota. This only added more fuel to the fire for explosive supercell development and continued instability for these storms to sustain themselves with the strong inflow.

mlcp_100618_00
This image below really tells the story as this is the RUC model analysis of the Effective Helicity values at 00Z 6/18. Incredible Effective Helicity of 450-700 m2/s2 is depicted across all of Minnesota ahead of this system. This is a direct result of the strong southeast inflow winds that were in place this day, and the quick turning of the winds with height across the Upper Midwest. One observation is that the strongest wind shear, possibly 700+ m2/s2 was across northern Minnesota where the lesser instability was in place, but the strongest instability and "slightly" less wind shear was analyzed by the RUC to be across southern Minnesota. I guess it did not matter as all of Minnesota was in a strong severe weather and tornadic environment anyways.

6shr_100618_00
More in-depth information and event summaries can be found through the links below from the local National Weather Service Offices that were impacted this day. The sites include analysis, radar and satellite loops, a breakdown of each tornado and rating, damage surveys, as well as other useful pieces of information. See below:
Twin Cities: https://www.weather.gov/mpx/June172010Outbreak
Grand Forks: https://www.weather.gov/fgf/20100617_tor_outbreak
La Crosse: https://www.weather.gov/arx/jun1710
Duluth: https://www.weather.gov/dlh/jun172010_svrwx
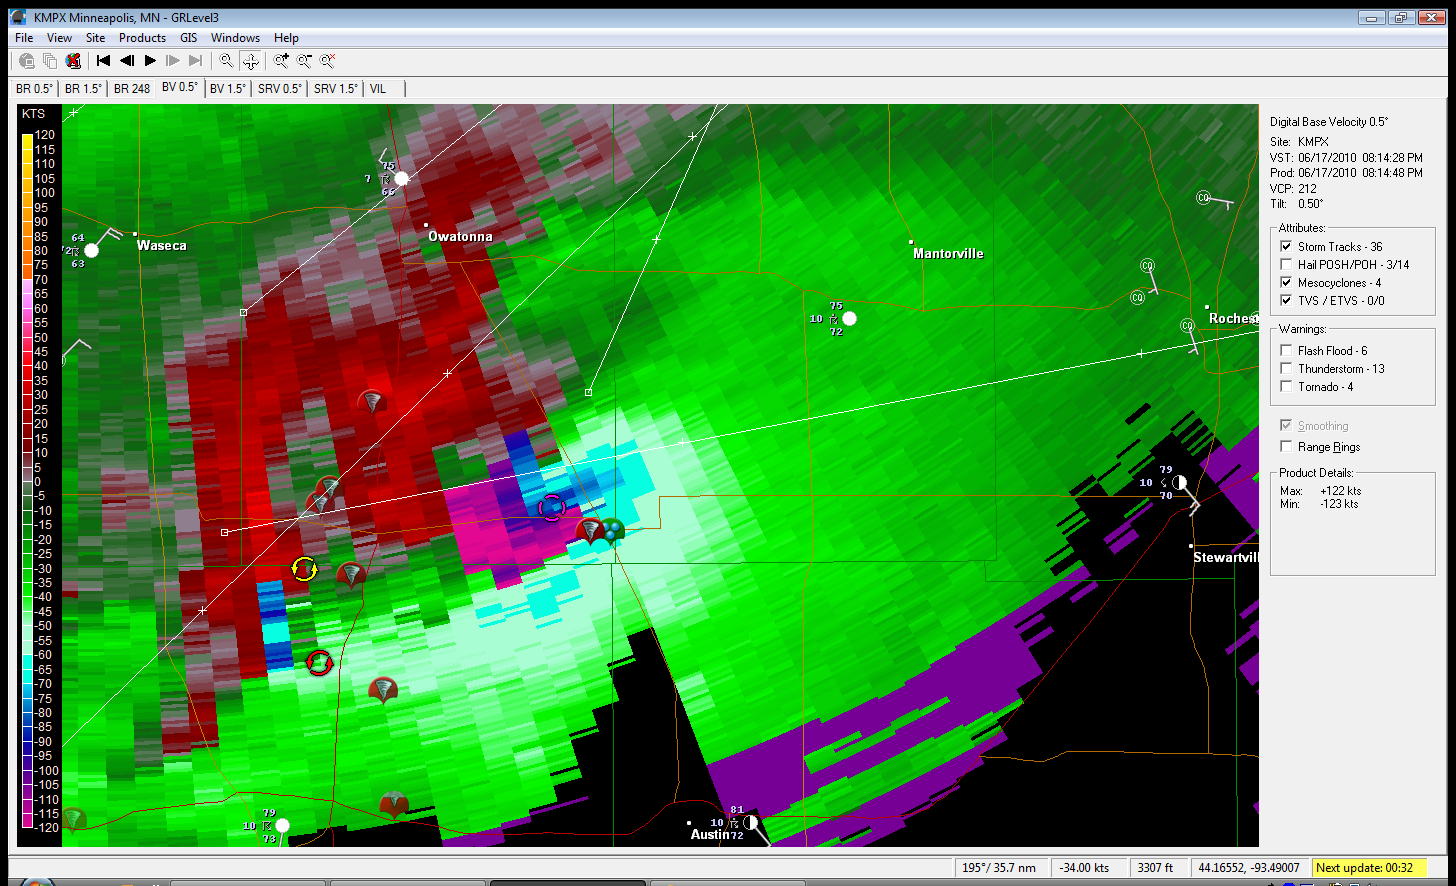
In addition, here are a few radar velocity grabs from when the tornadic storm was progressing close to my hometown of Blooming Prairie, Minnesota. This storm produced two tornadoes very close to my hometown. Notice the strong couplet of inbound and outbound winds to the southeast of Owatonna:

8
9